Restaurant Analytics Platform
Metrics
01
Overview
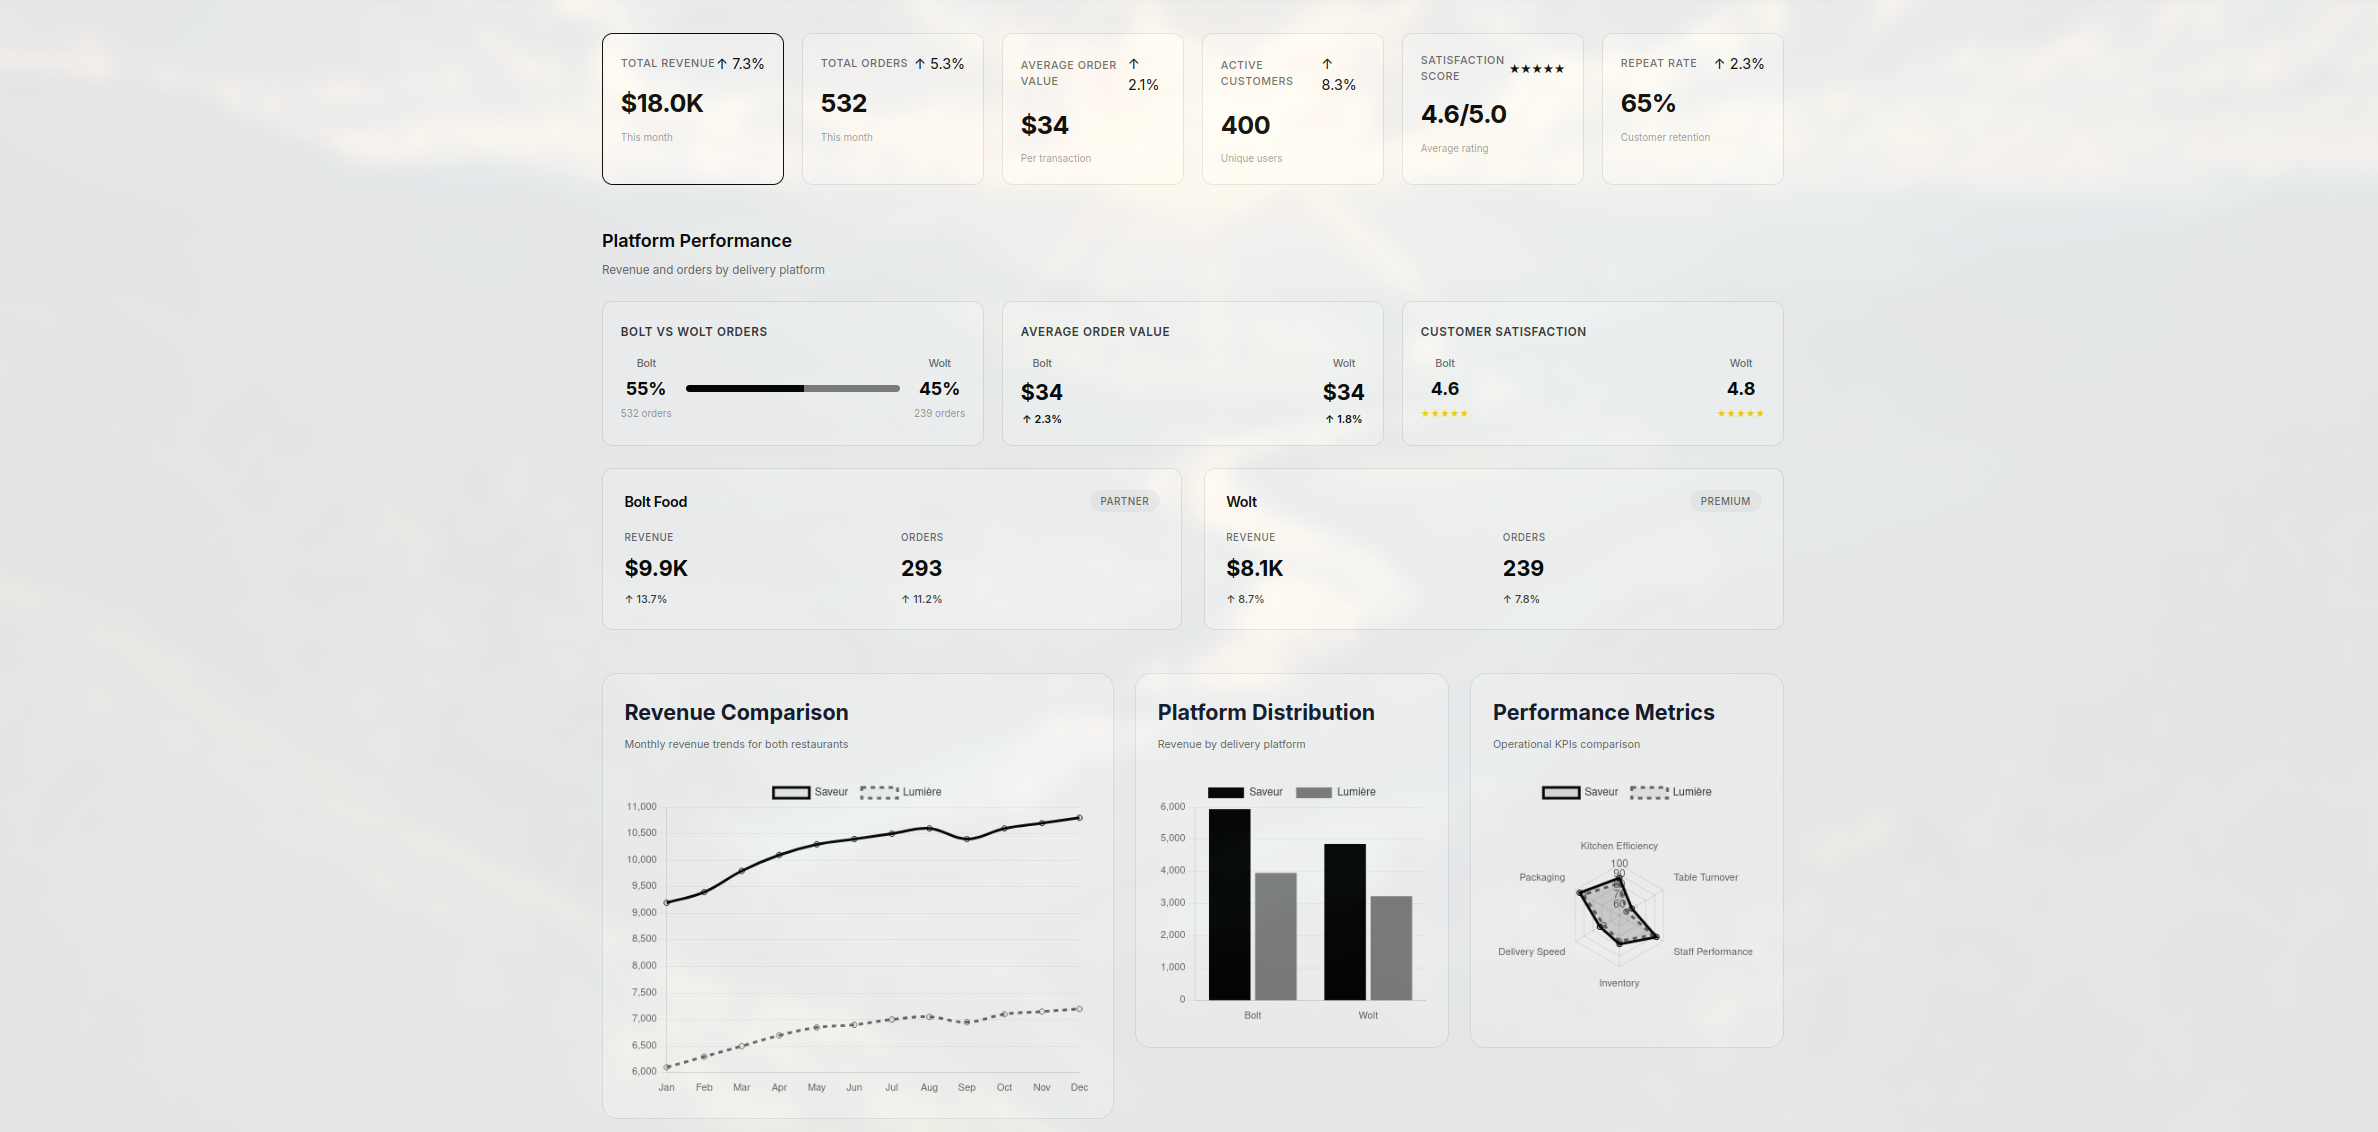
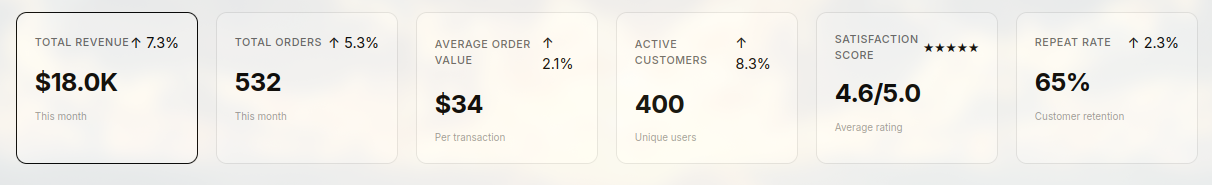
Running a restaurant on Wolt and Bolt means drowning in data — two separate CSV exports, two different formats, two sets of metrics that don't talk to each other. We built a platform that solves this. Upload your CSVs, and within seconds you have a unified dashboard showing revenue, order volume, average check, repeat customer rate, ratings, and top-selling items — all in one place, with filters by week, month, or year. No more spreadsheets. No more manual calculations. Just clarity.
02
Development
The project started with a genuine problem: restaurant owners were spending hours every week manually merging Wolt and Bolt reports in Excel, only to end up with tables that were hard to read and impossible to act on. We spent time with the client understanding exactly what decisions they needed to make — what to put on the menu, when to run promotions, which dishes were losing them money — and built the analytics around those questions. The technical core is a CSV parser that handles both Wolt and Bolt formats, normalises the data, and stores it in a PostgreSQL database structured for fast aggregation queries. Recharts powers the visualisations, chosen for its flexibility and performance with large datasets. The UI was designed around speed of comprehension — key numbers front and centre, comparative graphs that answer questions before you've had to ask them.
03
Two Platforms, One Dashboard
Wolt and Bolt each export data in their own format, with their own column names, their own logic for how orders are counted and categorised. Reconciling them manually is slow, error-prone, and frankly soul-destroying for anyone who has a restaurant to run. We built a parser that handles both formats natively — the moment a CSV is uploaded, it's classified, normalised, and merged into a unified data model. The restaurant owner sees one dashboard. One set of numbers. One source of truth.
04
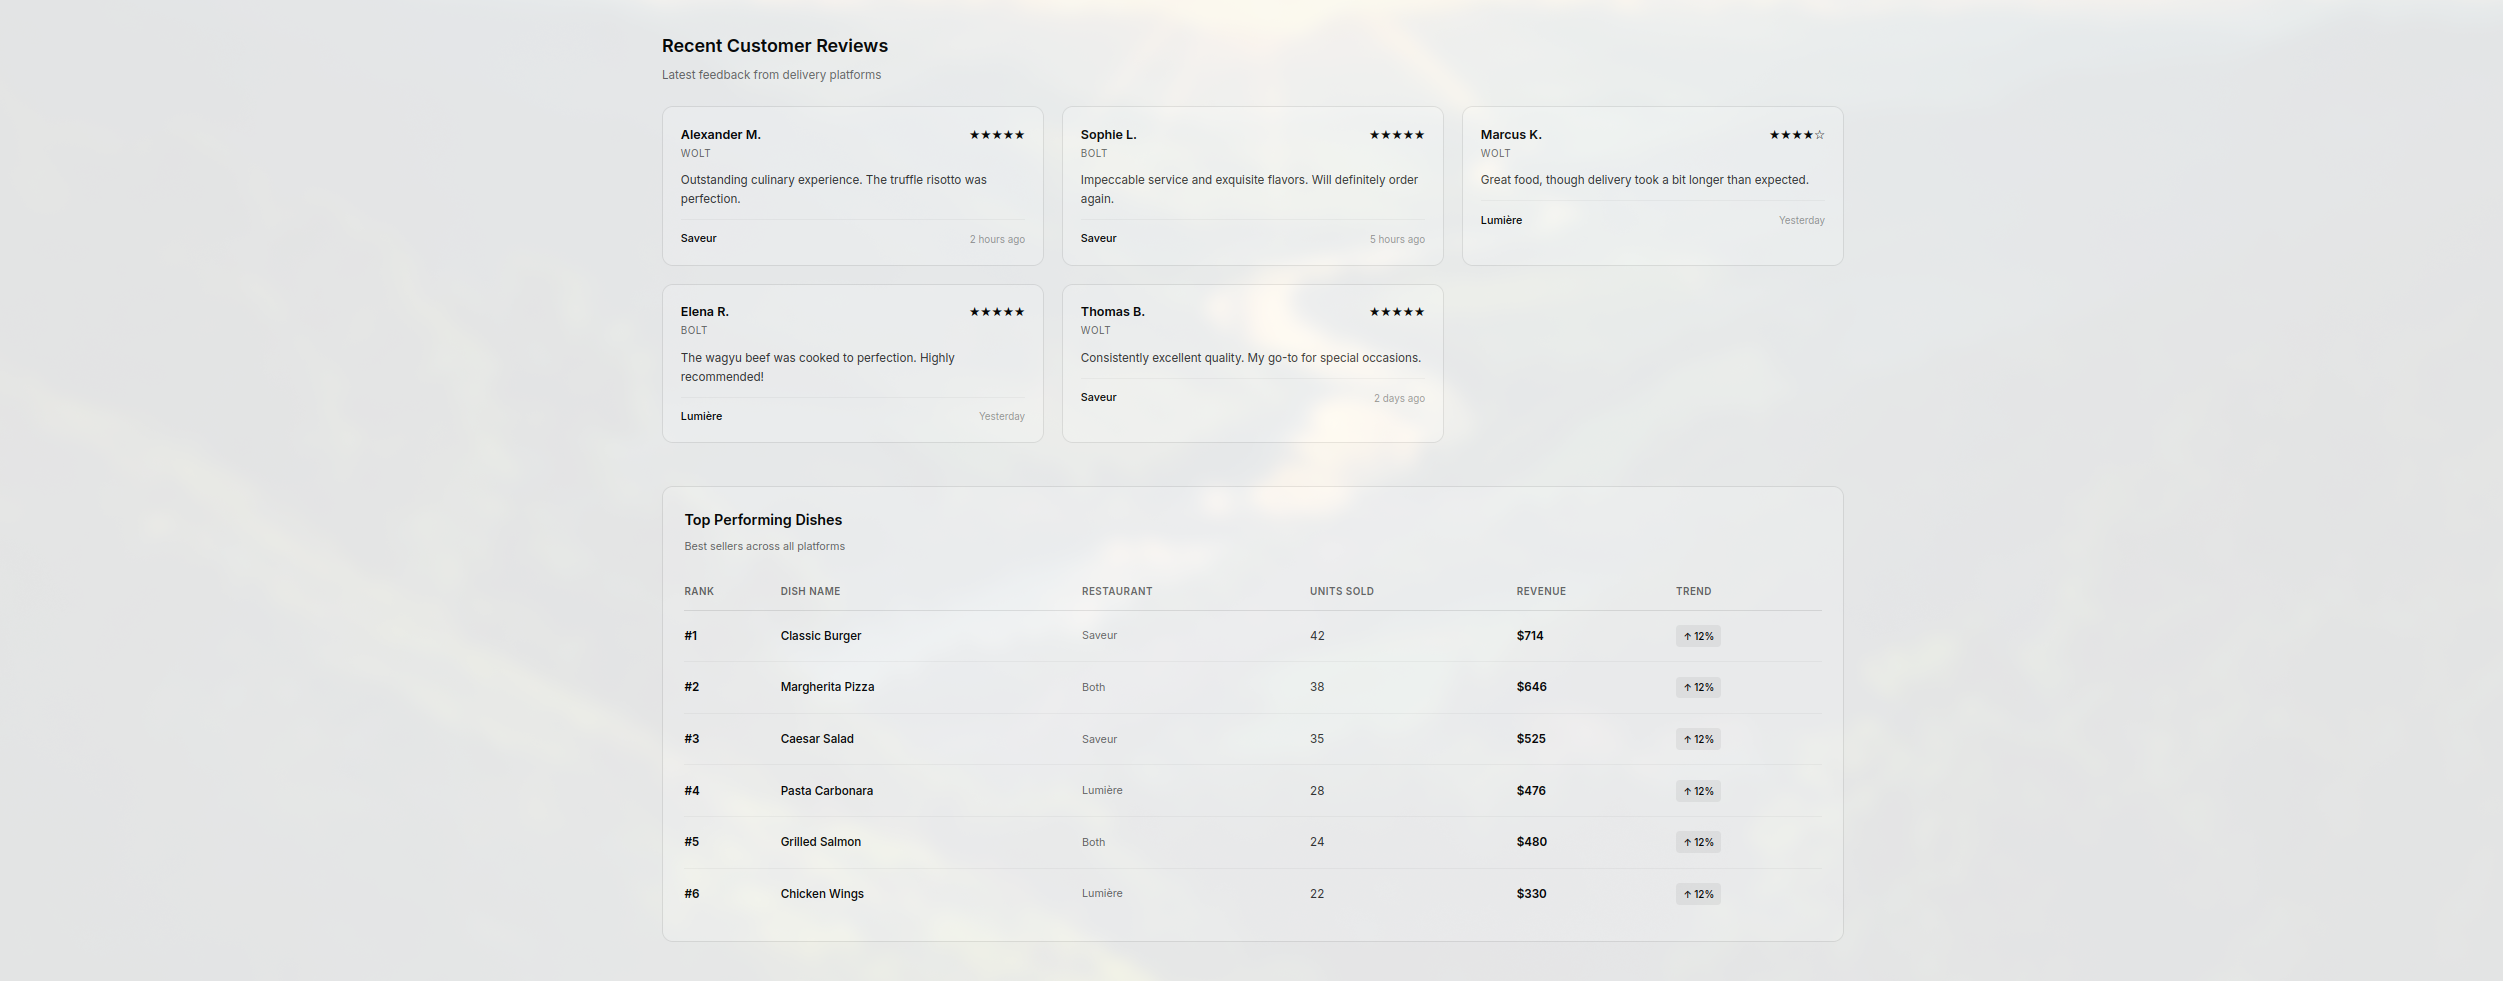
Numbers That Answer Questions
Most analytics tools show you data. This platform shows you answers. The dashboard is structured around the questions restaurant managers actually ask: Which dishes are selling? Is my average check going up or down? Are customers coming back? How was this month compared to last month? Every metric is presented with context — not just the number, but the trend, the comparison, and the direction. Recharts visualisations are built for clarity at a glance, not for impressing stakeholders in a boardroom.
05
Built for Speed at Scale
A busy restaurant on two delivery platforms generates thousands of order records every month. The platform needs to aggregate that data instantly — not after a loading spinner that kills the experience. We architected the PostgreSQL database with aggregation performance as the primary constraint: indexed by date, by platform, by product, by customer. Redis handles frequently-accessed queries. The result is sub-second response times even when filtering across a full year of data from multiple locations.
06
From Hours to Minutes
Before this platform, the weekly reporting process at Maitsev Sushi took roughly four hours: export from Wolt, export from Bolt, clean and merge in Excel, build charts manually, distribute to the team. Now it takes under five minutes. Upload the CSVs, open the dashboard, done. The time saved compounds: four hours per week is over 200 hours per year — time that goes back into running the restaurant, not reporting on it.